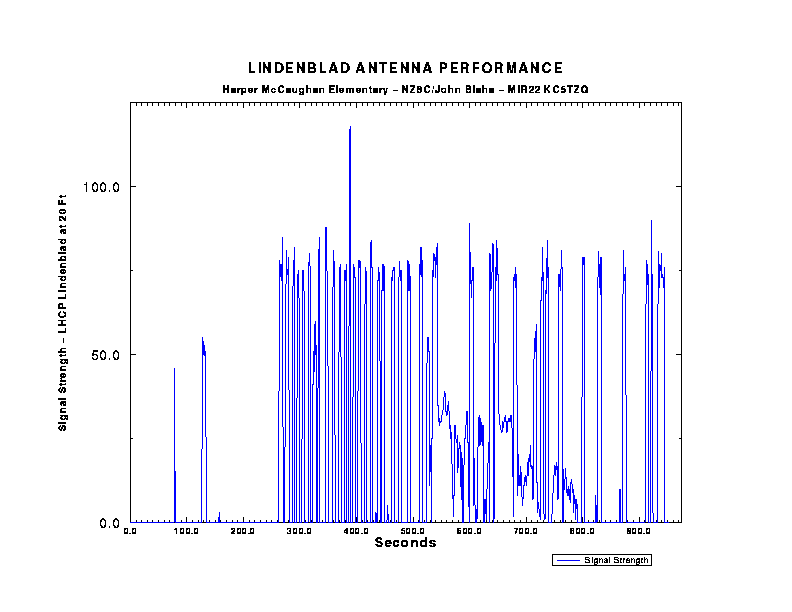

The Test Lindenblad's performance was encouraging, and supports further investigation as a possible solution or part of a solution towards reducing the complexity of a school ground station. Below is a graph of the IF strip readings taken once per second using the CI-V interface of the Science Data Receiver (ICOM R7100). Due to the proximity of the Test Lindenblad to the Primary/Backup Communications Antennas, some receiver overloading is experienced when the Primary Beam is at low elevation angles. The graph below is the raw data collected. In the near future, the data will be filtered to compensate for the receiver front-end overloading, producing a clean graph of the Lindy's performance.

